library(dplyr)
library(ggplot2)

iris <- iris

ggplot(iris) +
geom_point(aes(x = Sepal.Length, y = Petal.Length, color = Species))Introduction to ggplot2
What is ggplot2?
ggplot2 is an amazing package for data visualisation.
How to use ggplot2
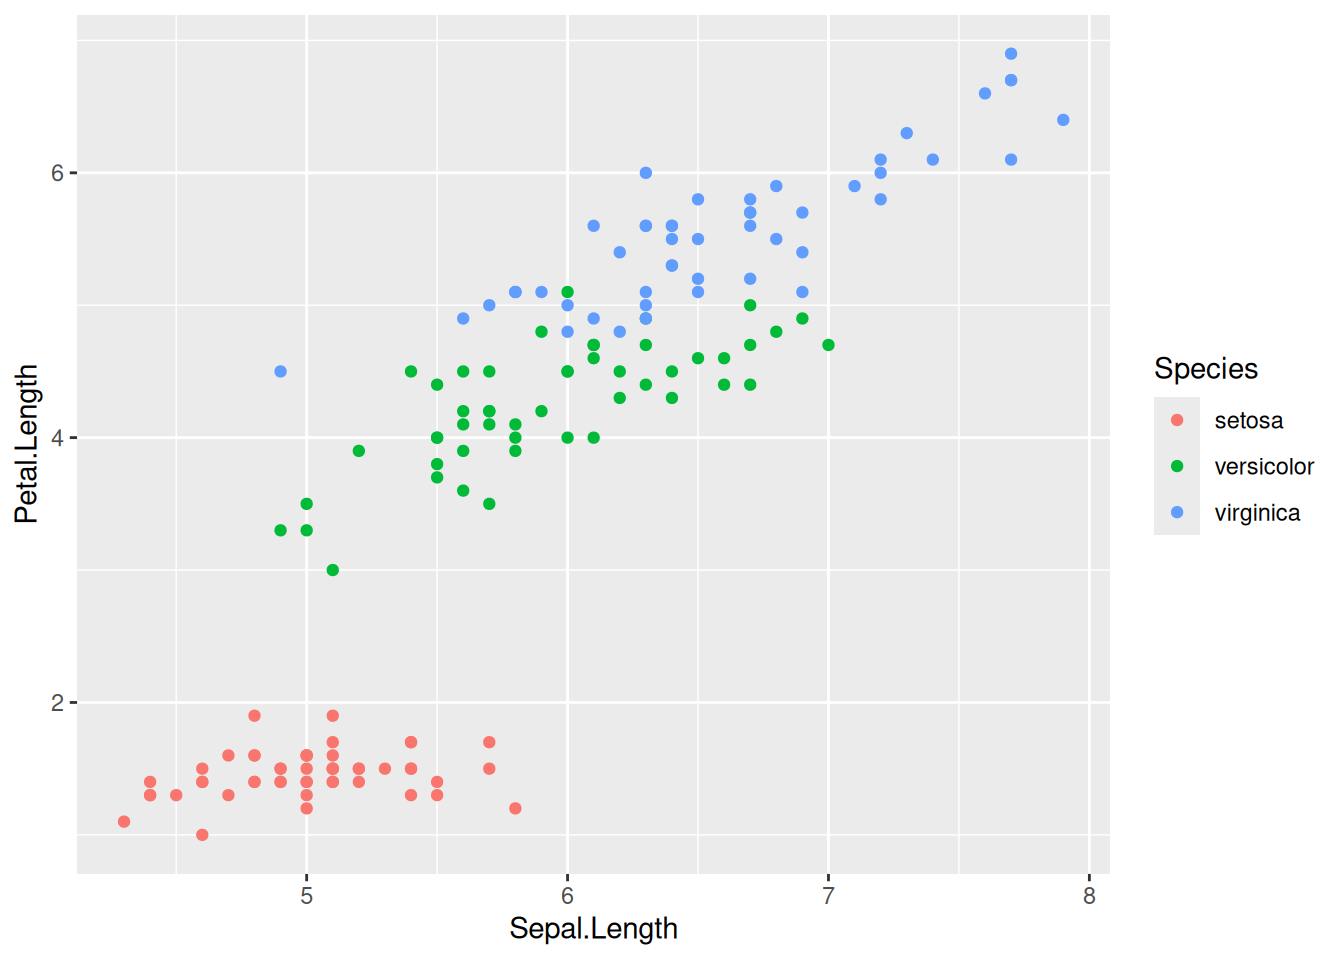
Here is a code snippet to produce a beautiful plot done with ggplot2.
And here is the amazing result.
Conclusion
Now you know everything on ggplot2.