Disclosure risks

Define, Assess, Decide

INSEE, Department of Statistical Methods

Introduction

Context

We will place ourselves in the following context:

  • A statistical institute collects individual data.
  • It is assumed that it complies with the regulations in force regarding the protection of individual data (for example, the GDPR in Europe).
  • The institute seeks to disseminate aggregated statistics or individual data files for statistical purposes.

Problem Statement

Workshop Overall Problem Statement

How can statistical information be disseminated without harming the individuals or organizations from whom the information was collected?

Protecting: a challenge for official statistics

The missions [of official statistics] do not depend solely on its ability to master the tools or methods necessary for producing quality information, but also on its ability to protect and guarantee the confidentiality of the data entrusted to it. This protection is the condition for continuing to have access to this data. (Redor 2023)

In Search of a Definition

A maximalist definition of disclosure…

T. Dalenius proposes in 1977 the following definition:

“If the publication of the statistics \(T(D)\) allows determining the value of confidential statistical data more precisely than would be possible without access to \(T(D)\), then a disclosure has occurred.” (Dalenius 1977).

… impossible to hold

This definition does not take into account the auxiliary information already available

An example of disclosure impossible to protect

Studies show a correlation between smoking and the occurrence of lung cancer \(\Rightarrow\) if, we (an insurance company) know that an individual is a smoker, then we can attribute to them a significant risk of having cancer, information which will very likely cause harm to that person.

In Search of a Definition

Two realities must be taken into account:

  • the user has auxiliary information.
  • statistical inference is one of the means of knowledge provided by the publication of statistics.

\(\Rightarrow\) unconditional and total protection is not possible.

Need to Master Risks

Data protection is defined through:

  • mastery of disclosure risks
  • and the need to continue disseminating statistical information.

\(\Rightarrow\) Need to arbitrate between the two components.

1 A Necessary Trade-off

Arbitrate

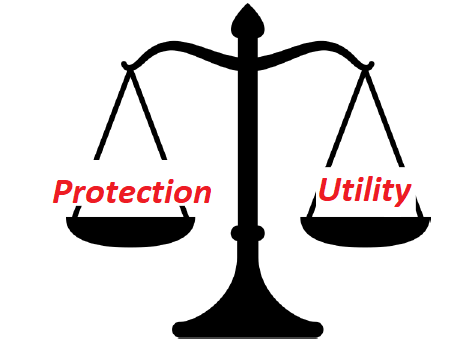
Protecting confidential data means arbitrating between:

  • their utility for knowledge and public debate;

  • their intrinsic risk: any data disseminated can disclose information about an individual or a group of individuals.

Risk-Utility Trade-off

Arbitrate

Two Pitfalls

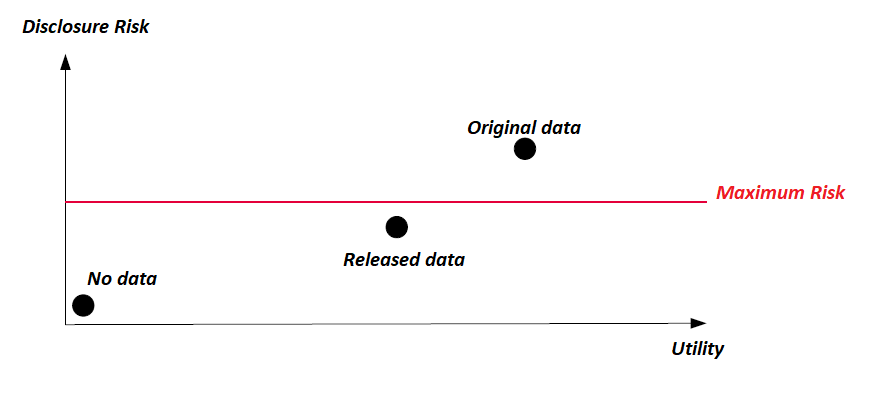
  • Not disseminating would make the public statistic useless.

  • Disseminating everything would make the public statistic dangerous.

Arbitrage Risque-Utilité

Arbitrer

Issues

  • What are the disclosure risks?
  • How to measure these risks?
  • How to address them?

\(\Rightarrow\) How to address them without too much deteriorating the statistical information?

Main issue of arbitration:

Finding a balance between protection and information

This involves achieving a compromise between minimizing the risks of disclosing confidential information and minimizing the loss of information due to data protection processes.

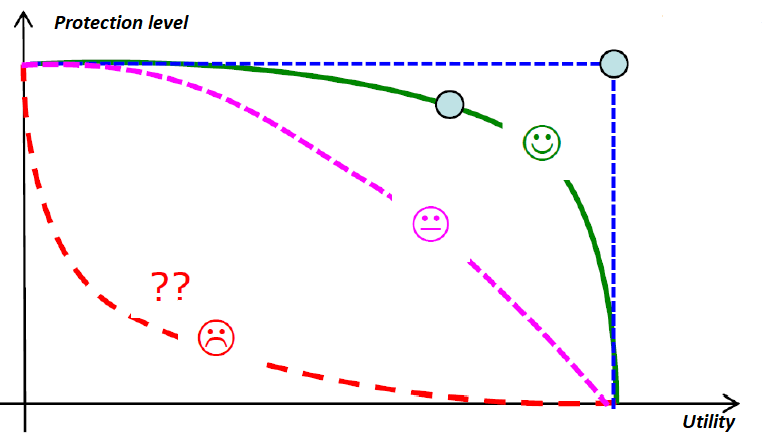
No Magic Method

There is no method that minimizes risk and information loss at the same time!

An example of arbitrage

The population census (RP) in France:

  • Specific publication decree;

  • Utility of RP data is very strong:

    • a number of laws depend on it
    • financial allocation to municipalities
  • Risk of using disseminated data against individuals is judged low:

    • information not very prejudicial
    • except for sensitive variables

An example of assumed disclosure

INSEE disseminates municipal data even for very small municipalities:

See the example of the municipality of Rochefourchat:

  • A municipality of (2) inhabitants
  • We know their sex, their marital status, their age, a rough description of their housing, the occupancy status of their housing, their education level, their employment status, etc.

The Risk/Utility Trade-off: a Paradigm

  • There is no such thing as zero risk

  • No method completely eliminates risk \(\Rightarrow\)

    • Trade-offs are therefore inherent to data protection.

    • This trade-off is considered the paradigm of the discipline.

A Criticizable Paradigm

(Voir Cox et al. 2011)

  • If it helps to know how to think…

  • …it helps less to know how to act.

In practice, another trade-off takes place

A Costs/Benefits trade-off is performed:

  • By the data producer:
    • What resources to deploy for what level of protection (time, financial means)?
  • By the attacker:
    • Is the hoped-for confidential information worth the resources necessary for its disclosure?

\(\Longrightarrow\) Implement methods that have a cost adapted to the identified risk and to the sensitivity of the data.

Objective: define and measure

To arbitrate, one must be able to

  • Define the terms of the arbitration

  • Measure the phenomena.

2 Need for governance

Data Governance

Before defining the risks:

  • What are the dissemination objectives?
  • Who accesses what with which rights?

Objective

To better manage risks, become aware of the context in which they are likely to appear.

Securing Access

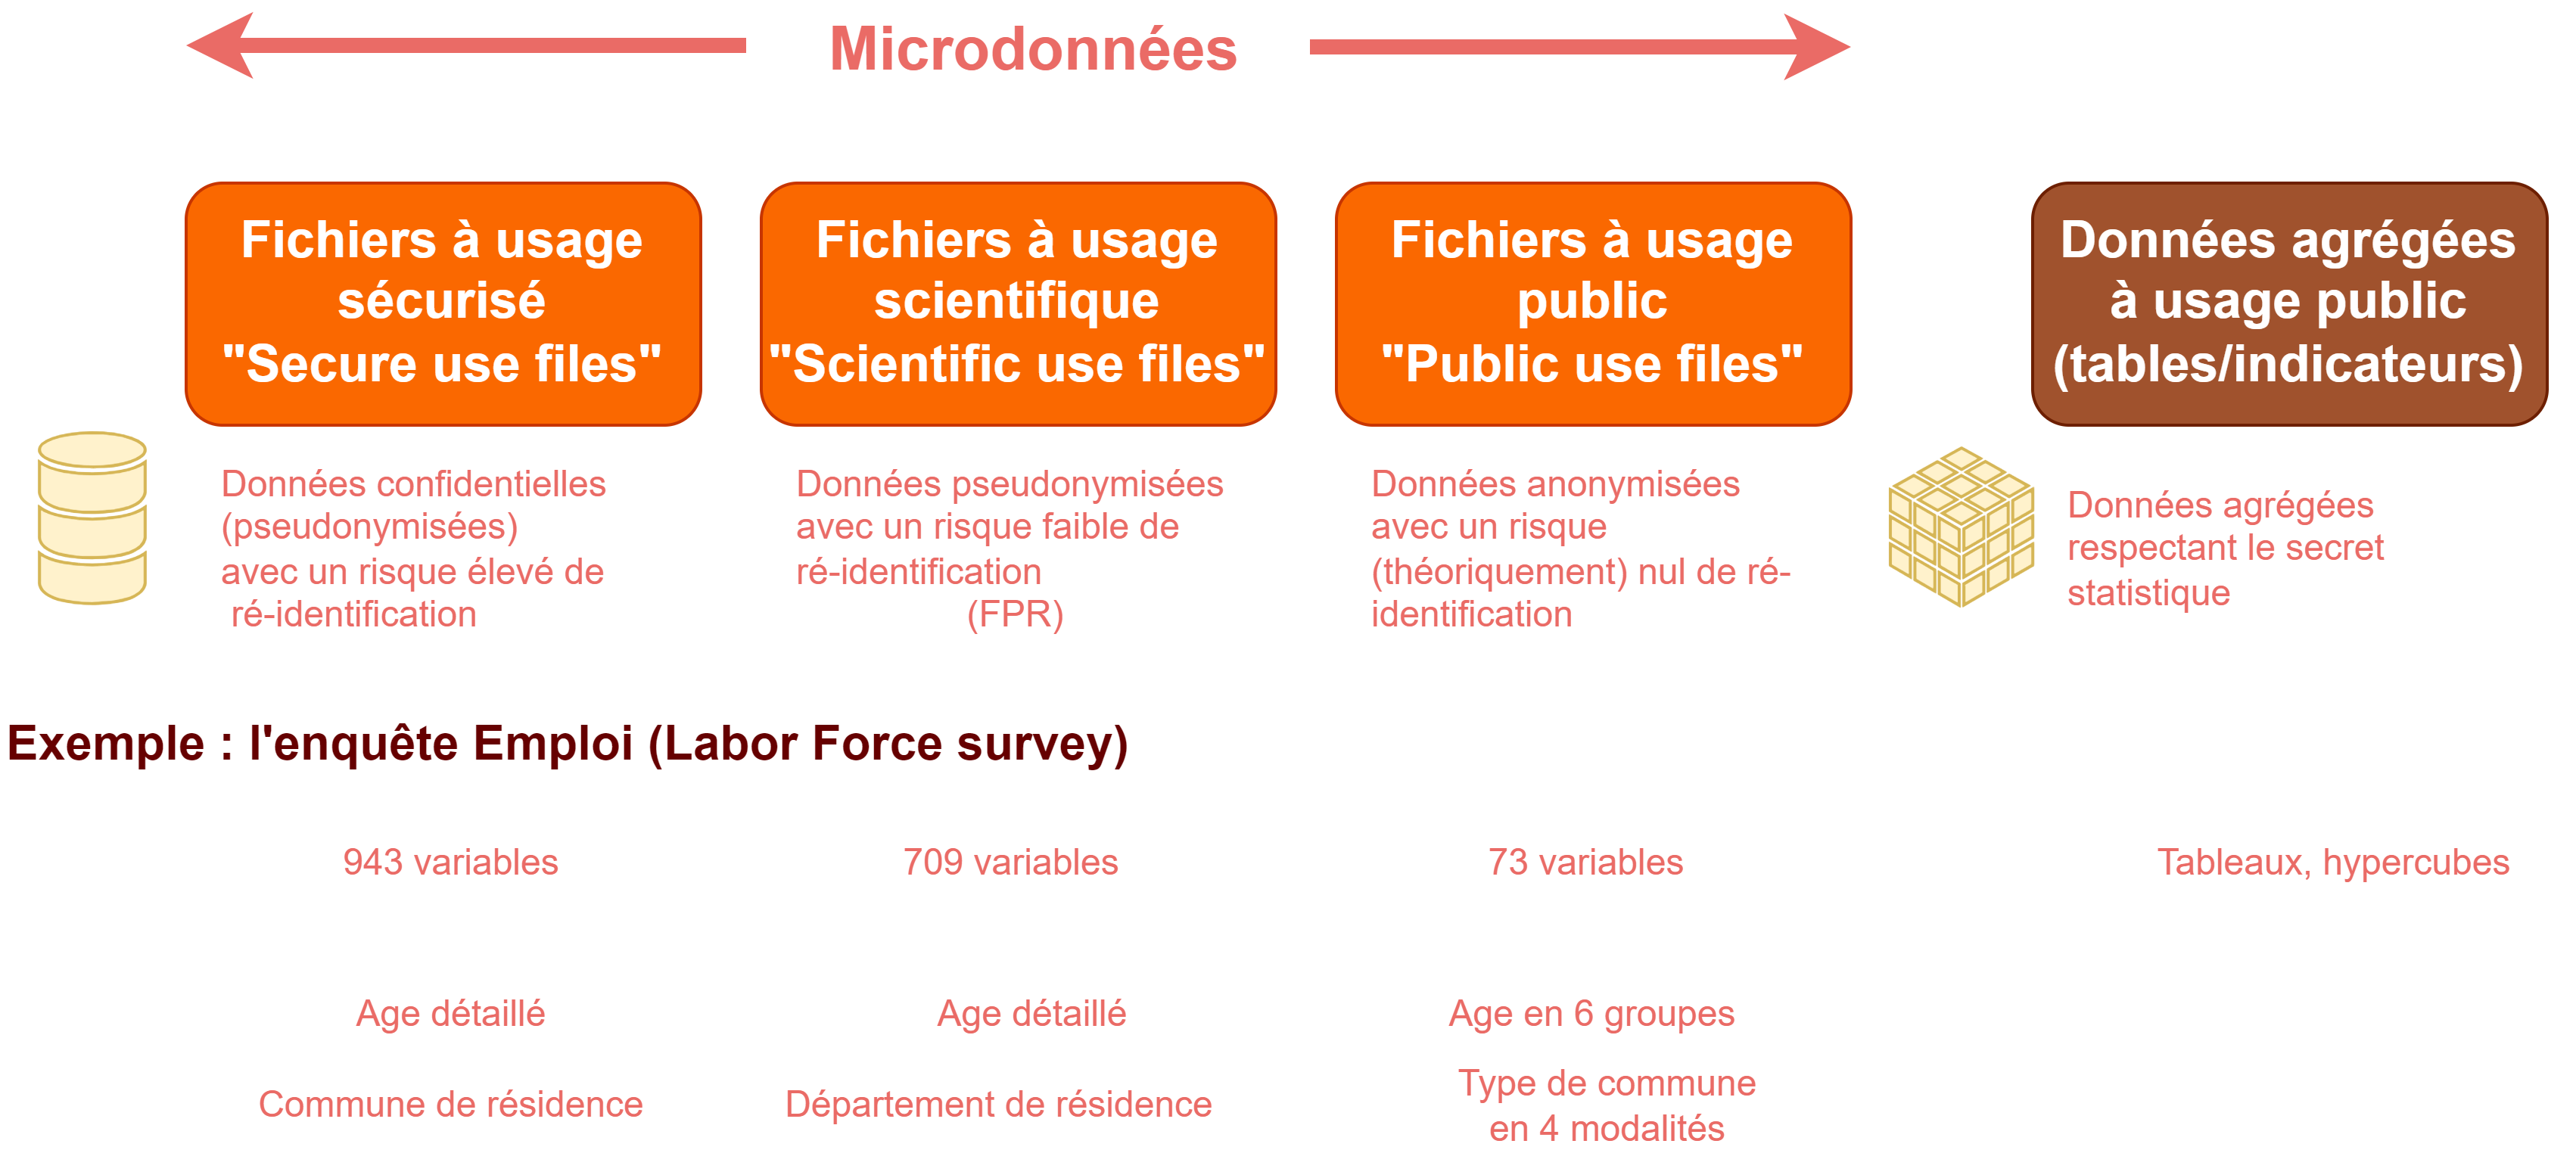
  • Four main types of users can be distinguished:

    • General public and public actors: aggregated statistics
    • Researchers: detailed statistics or even individual data
    • Public statistics study officers: individual data without direct identifiers
    • Data collection officers: individual data with identifiers

Adapt access based on user needs

  • Minimization principle: each user must access only the data strictly necessary for their missions.

Adapt access based on user needs

  • Access differentiation :
    • general public and public actors: free access without conditions.
    • researchers: access under strict conditions (contracts, public utility projects, secure working environment, etc.).
    • study managers: access to data on internal servers subject to prior authorization.
    • data collectors: access to collection data for the sole survey on which they are working.

Adapt access based on user needs

  • Ensure monitoring and control of access: each access must be able to be controlled and revoked if necessary.

Adjust the Necessary Anonymization Level

The looser the access, the higher the anonymization must be able to be:

  • general public:
    • open access \(\iff\) strong statistical protection

Adjust the Necessary Anonymization Level

The looser the access, the higher the anonymization must be able to be:

  • researchers and study managers:
    • secure access \(\iff\) weak statistical protection on the inputs
    • But need to process/verify the public outputs (output checking)

Adjust the Necessary Anonymization Level

The looser the access, the higher the anonymization must be able to be:

  • data collectors:
    • very secure access \(\iff\) no statistical protection of the data
    • But need to comply with regulations on the protection of individual data (GDPR in Europe). ## An example
Adapt files to audiences
Figure 1: Adapt files to audience type (Source: INSEE)

Governance, Ethics, Trust

  • Mastery of access security and the best possible data governance are not infallible shields.
  • Strong Ethics of public statisticians.
  • Trust in the various actors (researchers) to whom data access is granted.

Hold Accountable

A necessary accountability:

  • Public statisticians (in France, 1951 law on statistical secrecy)
  • Researchers (Risk of contract revocation and consequences for the entire laboratory)

3 A Multi-Step Approach

Key Steps in the Data Protection Process

  1. Is it necessary to protect the data?

  2. What are the main characteristics and uses of the data?

  3. Definition and measurement of disclosure risks

  4. Selection of data protection methods

  5. Implementation of the methods

  6. Controls and documentation

Source: (Hundepool et al. 2024)

Step 1: Is it necessary to protect the data?

  • Analysis of the units considered and variables present in the microdata file; if they are not sensitive, there is no need to perform processing for data protection

  • What type of dissemination? (data tables, maps, microdata ...)

Step 2: Main Characteristics and Uses of the Data (I)

  • Analysis of the type and structure of the data to determine the variables / units that require protection

  • Analysis of the survey methodology

  • Definition of the institute’s objectives: type of publication (PUF, MFR), dissemination policies, consistency between multiple simultaneous disseminations, consistency with what is already published

Step 2: Main Characteristics and Uses of the Data (II)

  • Analysis of user needs (priority variables, types of analyses that will be performed)

  • Analysis of the questionnaire for surveys (variables to remove / to include, what level of detail for structural indicators such as socio-demographic variables?)

Step 3: Definition and Measurement of Disclosure Risks

  • Identify the different possible scenarios leading to data disclosure

    • Depending on the type of data considered (exhaustive data, surveys)
    • Depending on the target audience (researchers, decision-makers, general public)
  • Choose the disclosure risk measure(s)

  • Risk tolerance threshold to set

Step 4: Selection of Methods

  • Choose one / several protection method(s)

  • Compare the methods: risk level vs loss of utility

Risk-Utility Trade-off
Figure 2: Risk-Utility Trade-off

Step 5: Implementation of the methods

  1. Choose software

  2. Perform the measurement of disclosure risks

  3. Protect the data

  4. Quantification of information loss

Step 6: Controls and documentation

  • Process protection control

    • verify that the methods implemented have effectively reduced the disclosure risk to the level considered acceptable
  • Preparation of a document summarizing the methods used and providing an overview of the information loss

    • if possible, transmit it to the users of the published data
    • may contain warnings about precautions to take when using an anonymized file

4 Define the risk

The risk of disclosure

General Definition

Risk of disclosing confidential information by publishing aggregated or individual data.

Four types of disclosure risk

  • Identity disclosure risk

  • Attribute disclosure risk

  • Disclosure risk by inference

  • Disclosure risk by differentiation

    • by “nesting”

    • by “cross-referencing”

Risk of Identity Disclosure

Definition

Risk of recognizing a specific individual in the published data: an attacker can identify a unit from the publication.

Examples:

  • Certain variables such as name, address that identify directly individuals or households.

  • All people with very rare characteristics (e.g., very elderly people).

  • 87% of the U.S. population is unique solely from ZIP code, gender, and date of birth (Sweeney 2000).

Remarks

  • Direct identifiers (name, first name, address) are useful for collection but removed from statistical databases.

  • Other variables have a strong re-identifying power (place of residence, age, gender, profession, education level, etc.).

  • Re-identifying does not always allow obtaining more information about people.

Risk of Attribute Disclosure

Definition

Risk of disclosing sensitive information about one or more individuals from the disseminated data.

Examples:

  • Re-identification often leads to attribute disclosure.
  • It is possible to disclose an attribute about entire groups.

Disclosure of a Group Attribute

  • Disclosure of sensitive information for an entire group of people.
  • Without necessarily needing to re-identify beforehand.
Femmes Hommes
Diabétiques 30 40
Non diabétiques 12 0
Table 1: An example of group attribute disclosure

Risk of Disclosure by Inference

Definition

Risk of being able to deduce with high certainty sensitive information about individuals from published data.

  • Strong correlation of information with a sensitive characteristic.
  • Very high proportion within a group.
Women Men
Diabetic 30 38
Non-diabetic 12 2
Table 2: An example of attribute disclosure by inference

Risk of Disclosure by Differentiation

Definition

When aggregated information is disseminated for various cross-tabulations, it is sometimes possible to infer additional information by differentiating the various results.

Examples:

  • Marginal differentiation: consists of using the margins of tabulated data
  • Differentiation by geographic nesting: consists of using aggregates disseminated over nested zonings (variant of the first)
  • Differentiation by cross-tabulation: consists of using aggregates disseminated over imperfectly nested zonings

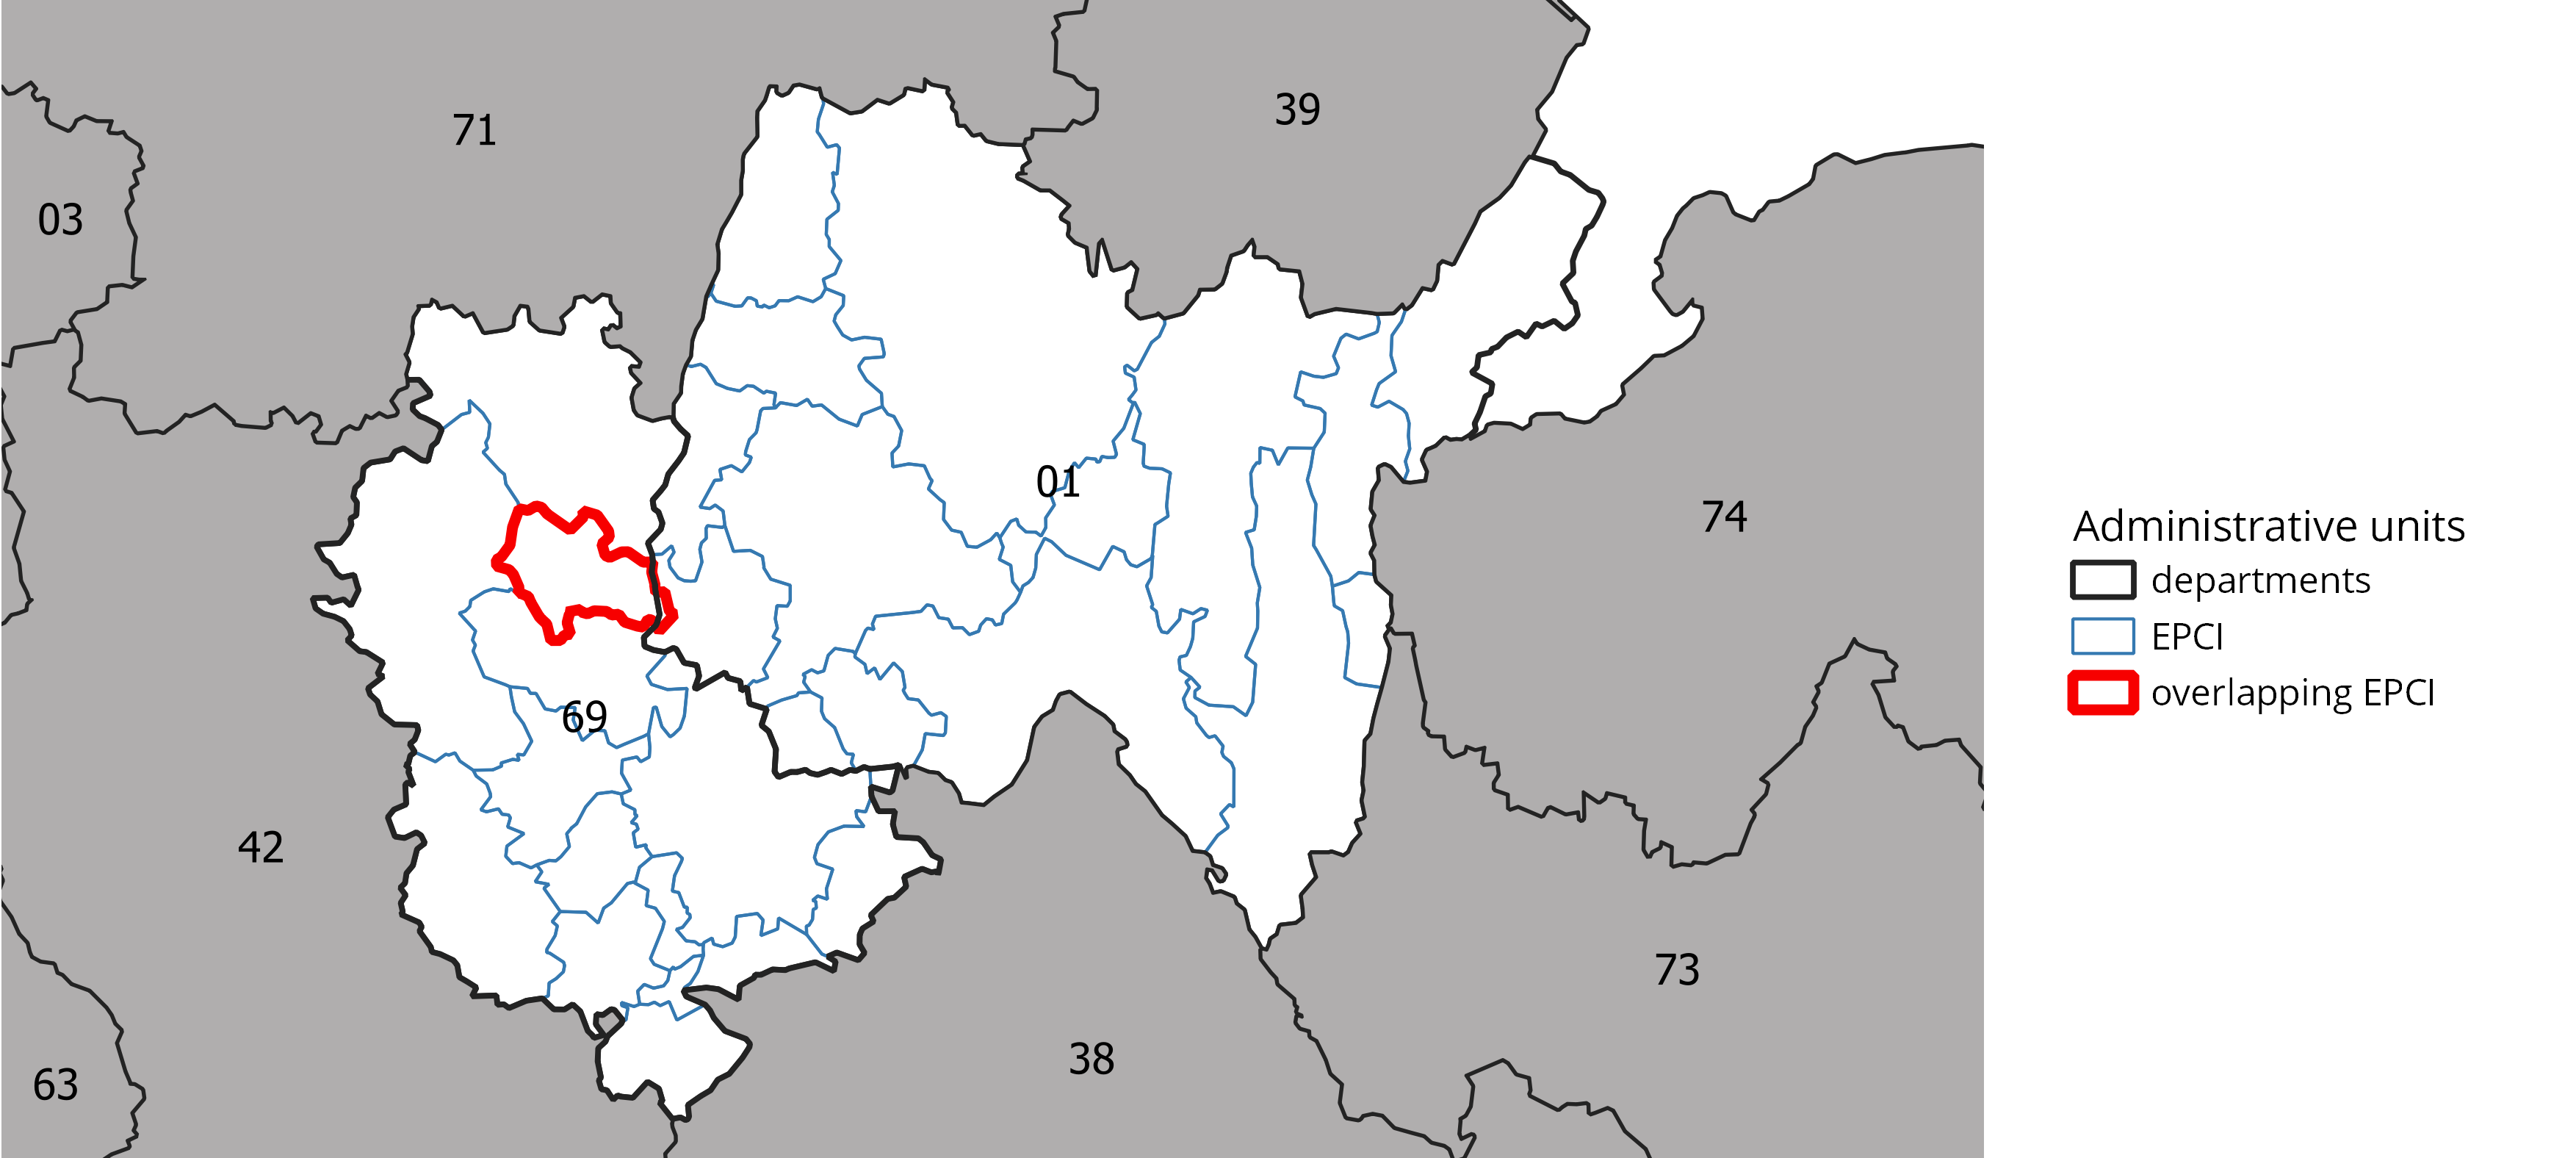
Differentiation by Overlap

Example of differentiation by overlap
Figure 3: Example of differentiation by overlap in France between a department and a community of communes (EPCI)

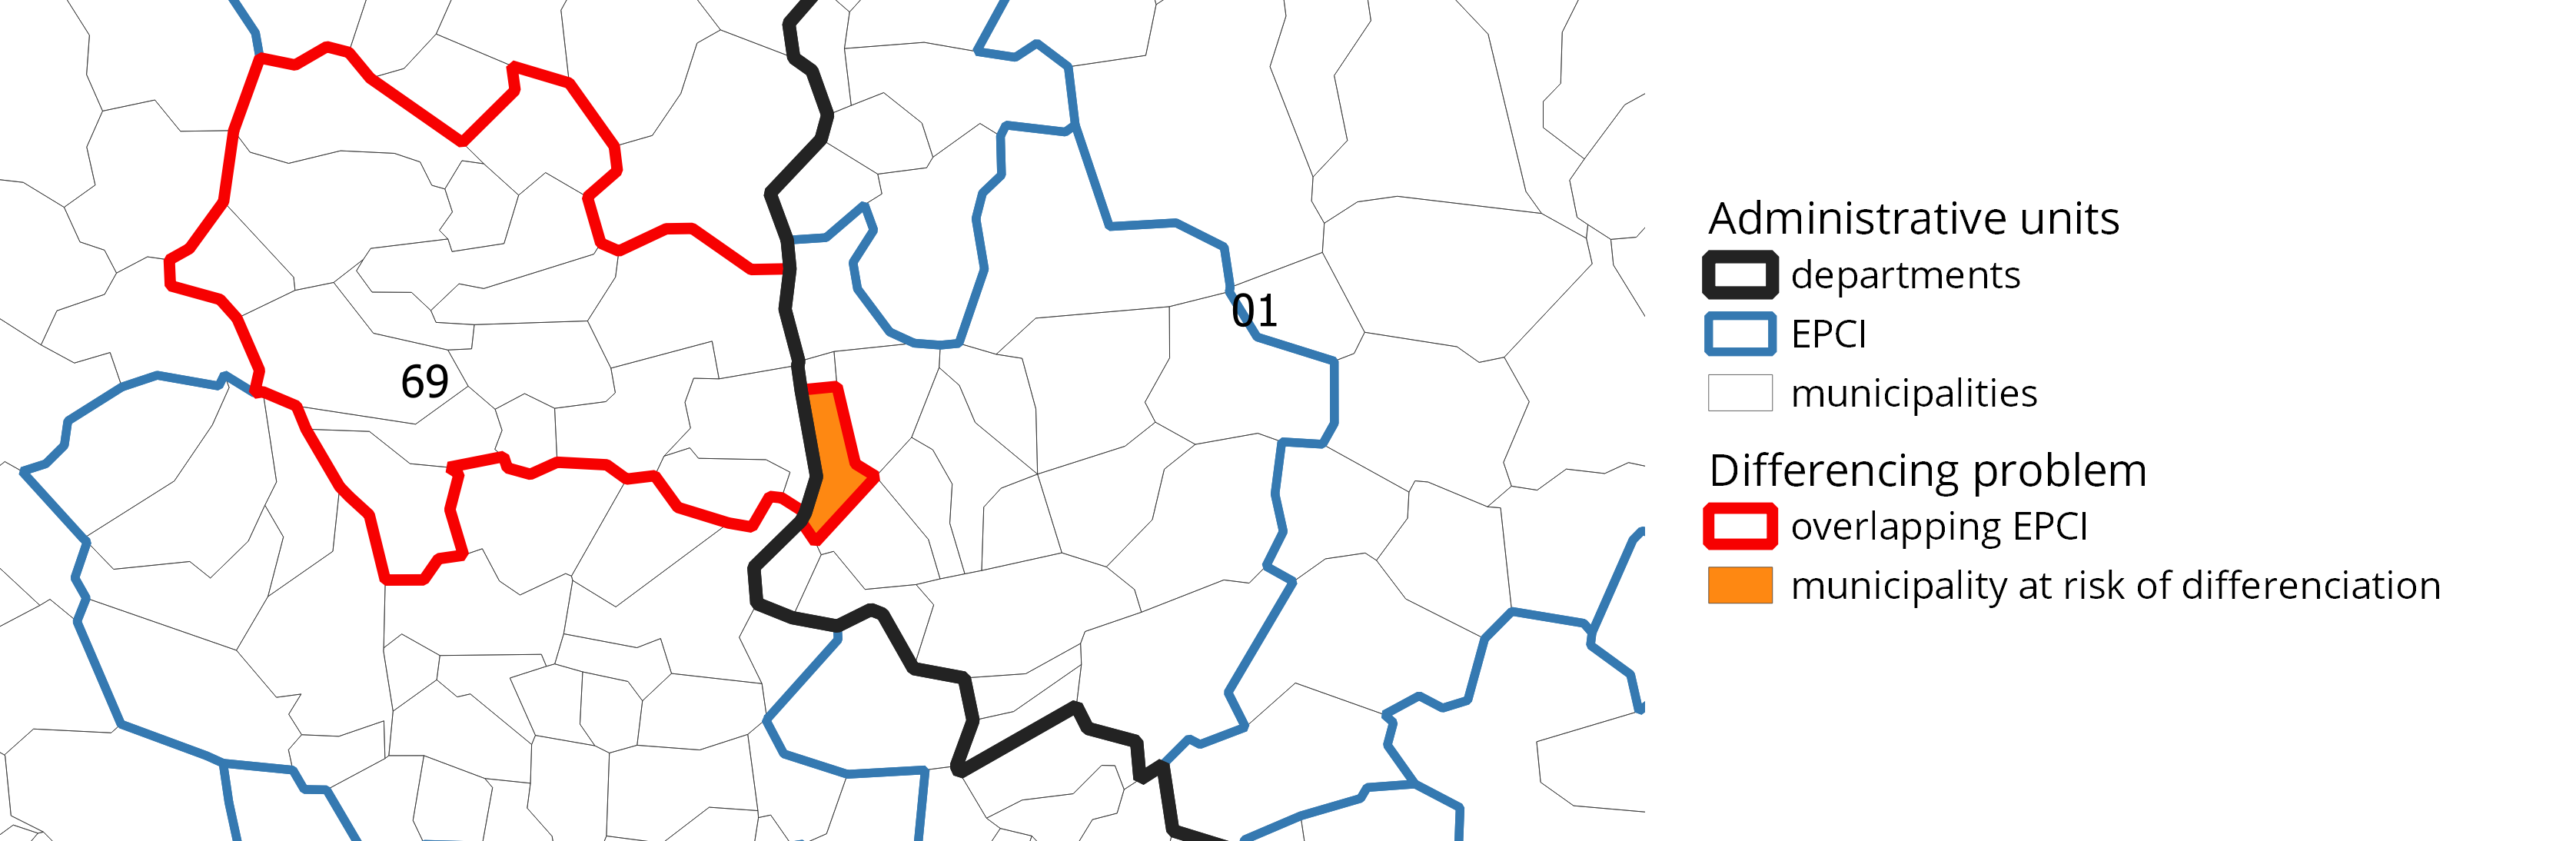
Differentiation by Cross-Referencing

Example of differentiation by cross-referencing
Figure 4: Zoom on the differentiation problem

5 Measuring the Risk

Distinguishing Variables

In an individual dataset, we distinguish:

  • Identifiers: Variables that allow direct identification of an individual.

  • Quasi-identifiers: Variables that can lead to re-identifying an individual using auxiliary information.

  • Sensitive variables: Variables for which specific protection measures may be necessary.

  • Other variables

Identifiers

  • Identifiers are removed very early in the production process to comply with data protection regulations.

  • Thereafter, it will be assumed that all direct identifiers have been removed.

Quasi-identifiers

  • For individual/household data: sex, age, place of residence, diploma, marital status, etc.

  • For company data: sector of activity, location of headquarters, etc.

  • List to be determined each time

  • What variables does an attacker already have?

An example

Identifiants
Quasi Id.
Sensible
Nom Adresse Commune Age Diplôme Revenus
Johan 3 rue... Paris 36 Bac 150000
Jeanne 11 bd... Malakoff 41 Bac+3 60000
Johnny 12 pl... Pithiviers 23 Bac Pro 25000
Jeannette 8 rue... Belval 85 10000
Table 3: Different types of variables

Quantifying the risk (1): k-anonymity

\(k\)-Anonymity (Sweeney 2002)

A dataset is considered k-anonymous if the least frequent combination of modalities of the quasi-identifying variables includes at least k units.

  • This measure ensures that all individuals are similar to at least \(k-1\) others.

  • Overall risk measure that focuses on the individuals most at risk of re-identification.

  • The probability associated with the risk for an individual in the file of being re-identified is at minimum \(1/k\)

  • Choice of \(k\) taking into account existing rules and/or risk-utility trade-offs.

The Envisioned Attack Scenario

Important

The YAML, code block syntax, and callout structure have been preserved exactly as in the original French version.

Characteristics of the Attack Scenario

k-anonymity protects data from a re-identification attack when the attacker has auxiliary information about the same individuals (at least one):

  • If the intruder knows that a specific individual is in the dataset, k-anonymity is a fair way to assess the risk of re-identification.
  • The attacker performs a matching between the two datasets.
  • Quasi-identifiers (QI) serve as matching keys.
  • The rarer an individual’s characteristics are on the QI, the better the re-identification will be.
    • The unique ones on the QI: re-identification will be certain
    • The more common an individual is, the lower the probability of re-identification will be.

The Importance of the Script

An effectiveness that depends on the realism of the scenario

Ensuring a certain level of anonymity helps reduce the risk of re-identification, but:

  • If the attacker has more auxiliary information \(\Rightarrow\) underestimation of the risk with \(k\)-anonymity.
  • Over time, the attacker may have more information. However, the scenario is set once \(\Rightarrow\) underestimation of the risk with \(k\)-anonymity.
  • If the attacker has less auxiliary information \(\Rightarrow\) overestimation of the risk with $k-anonymity*.
  • The quality of matches depends on many other factors (vintages, quality of variables, consistency of fields, etc.) \(\Rightarrow\) overestimation of the risk with \(k\)-anonymity.

An example

Id Age Gender Disease
1 [45;55[ M Diabetes
2 [45;55[ M Arterial hypertension
3 [45;55[ F Cancer
4 [45;55[ F Flu
5 [70;75[ M Diabetes
6 [45;55[ M Diabetes
Table 4: Example of a 1-anonymous individual file, with age and gender considered as quasi-identifiers

Limits of \(k\)-anonymity

  • Strong dependence on the quality/truthfulness of the scenario
    \(\Rightarrow\) choice of QIs is crucial.
    • \(k\)-anonymity overestimates the risk if the attacker has less information than assumed
    • \(k\)-anonymity underestimates the risk if the attacker has more information than assumed
    • Difficult to measure the plausibility of the attack.
  • \(k\)-anonymity does not take sampling weights into account. \(\Rightarrow\) Applied to a sample, it will overestimate the re-identification risk.
  • Does not reduce risks of disclosure of sensitive attributes.

Quantifying the Risk (2): l-Diversity

The l-diversity (Machanavajjhala et al. 2007)

It ensures sufficient diversity of the values of a sensitive variable taken by individuals within the same combination of quasi-identifiers.

  • Refinement of \(k\)-anonymity.

  • Protection against the disclosure of sensitive attributes.

  • Each group must contain at least \(l\) different values of the studied sensitive variable (or \(l\) of the most frequent values).

  • Choice of the target \(l\) based on existing rules and/or a risk-utility trade-off.

An example

Age Sex Disease
[50;55[ M Diabetes
[50;55[ M Diabetes
[50;55[ F Cancer
[50;55[ F Flu
[50;55[ M Diabetes
Table 5: A 2-anonymous file but not diversified enough

Envisaged Attack Scenarios

(Machanavajjhala et al. 2007)

  • Lack of homogeneity
  • Use of auxiliary information

Limits

  • Suitable for categorical sensitive variables only
  • => poorly suited for continuous variables (e.g. CA, standard of living, etc.)

6 Probabilistic Measures of Risk

Some notations for going further

  • \(N\): the population size
  • \(n\): the size of the possible sample
  • \(w_i\): the weight of individual \(i\) in the sample (\(\sum_i{w_i}=N\))
  • \(c\): the group formed by a type of crossing of the quasi-identifying variables.
    • For example, if the QIs are age and sex, \(c\) may correspond to the crossing \([25; 35] \times\) Women, or \([55; 95] \times\) Men, etc.
  • \(N_c\): the number of individuals in the population sharing the characteristics \(c\)
  • \(n_c\): the number of individuals in the (possible) sample sharing the characteristics \(c\)

\(\Rightarrow\) If a comprehensive file is \(k\)-anonymous, then \(\forall c, N_c \geq k\).

Individuals most at risk of re-identification

  • Unique in the population: \(N_c = 1\)

  • Unique in the sample: \(n_c = 1\)

  • Unique in the sample who are also unique in the population: \(n_c = 1\) et \(\sum\limits_{i \in c}{w_i} = 1\)

Measuring individual risk in a comprehensive file

  • k-anonymity and l-diversity are global measures.

  • We can move to the individual level:

    • by considering as at risk each individual in a group of modalities with fewer than \(k\) individuals
    • by associating with each individual in the database an individual measure of re-identification risk:

    \[r_c = \frac{1}{N_c}\]

Measuring individual risk in a sample

Probability of re-identifying an individual in a sample

  • At the sample level: \[r_c = \frac{1}{n_c}\]

    • If the presence of an individual in the sample is known to the attacker, this is an adequate measure.
    • Otherwise, this measure overestimates the re-identification risk.
  • At the population level, the re-identification risk can be estimated by:

\[\hat r_c = \frac{1}{\sum\limits_{i \in c}{w_i}}\]

where \(\sum\limits_{i \in c}{w_i}\) is an estimate of \(\hat N_c\).

A global measure of risk

To perform the arbitrage, a global risk measure is more practical. One can consider:

  • The number of uniques (in the sample or the population, depending on the case);
  • The average individual risk defined, in the context of a sample, by: \[\tau = \frac{\sum\limits_{c}{n_c \times r_c}}{n}\]

Probabilistic Risk Measures

More refined measures are implemented in classic tools such as \(\mu\)-Argus or the R package sdcMicro.

  • When a sample is available (thus the \(n_k\)), the \(N_k\) are generally unknown.

  • Measure of individual risk conditional on the sample: \(r_k = \mathbb{E}(\frac{1}{N_k}|n_k)\).

  • Measure depending on a modeling of the (posterior) distribution of \(N_k | n_k\)

    • Modeling of key frequencies in the population conditional on their frequency in the sample.

    • By a negative binomial, for example, in Benedetti and Franconi (1998).

7 Other Measures

Record Linkage

  • A posteriori measure of the distance between individuals in the protected dataset and those in the original dataset.

  • Allows evaluating the number of exact matches between perturbed data and original data.

Outliers

  • High risk of re-identification of individuals with values in the tail of the distribution (e.g., very high incomes of footballers)

  • A perturbation is not always sufficient (A perturbed outlier often remains an outlier).

  • Detection of outliers based on the quantiles of the distribution.

8 Attack Scenarios

Define an Attack Scenario

Attack Scenario

Defining attack scenarios involves considering the means used by the attacker and objectifying the fraudulent uses that we seek to prevent.

  • Cost/Risk Trade-off (INS)

  • Cost/Benefit Trade-off (Attacker)

Attacks on k-anonymous and/or l-diverse data

Cohen (2022)

9 Conclusion

In conclusion

  • There are many ways to evaluate information loss.

  • Strongly linked to the level of protection.

  • Many methods to evaluate information loss; the choice of measure depends entirely on the end users of the published data.

  • Difficult to anticipate all uses of a dataset and therefore all associated measures of information loss.

  • Need to make trade-offs on certain characteristics of a table to relax constraints elsewhere.

  • It is impossible to preserve all characteristics of a dataset.

10 For further reading

Bibliography

Benedetti, Roberto, and Luisa Franconi. 1998. “Statistical and Technological Solutions for Controlled Data Dissemination.” Pre-Proceedings of New Techniques and Technologies for Statistics 1: 225_232.
Cohen, Aloni. 2022. Attacks on Deidentification’s Defenses. arXiv. http://arxiv.org/abs/2202.13470.
Cox, Lawrence H., Alan F. Karr, and Satkartar K. Kinney. 2011. “Risk-Utility Paradigms for Statistical Disclosure Limitation: How to Think, But Not How to Act: Risk-Utility Paradigms for SDL.” International Statistical Review 79 (2): 160–83. https://doi.org/10.1111/j.1751-5823.2011.00140.x.
Dalenius, Tore. 1977. “Privacy Transformations for Statistical Information Systems.” Journal of Statistical Planning and Inference 1 (1): 73–86. https://doi.org/10.1016/0378-3758(77)90007-6.
Hundepool, Anco, Josep Domingo-Ferre, Luisa Franconi, et al. 2024. Handbook on Statistical Disclosure Control. 2nd Edition. ESSNet SDC. https://sdctools.github.io/HandbookSDC/.
Machanavajjhala, Ashwin, Daniel Kifer, Johannes Gehrke, and Muthuramakrishnan Venkitasubramaniam. 2007. “L-Diversity: Privacy Beyond k -Anonymity.” ACM Transactions on Knowledge Discovery from Data 1 (1): 3. https://doi.org/10.1145/1217299.1217302.
Redor, Patrick. 2023. “Confidentialité Des Données Statistiques : Un Enjeu Majeur Pour Le Service Statistique Public.” Courrier Des Statistiques, no. 9: 46–64. https://www.insee.fr/fr/information/7635823?sommaire=7635842.
Sweeney, Latanya. 2000. “Simple Demographics Often Identify People Uniquely.” Carnegie Mellon University, Data Privacy Working Paper 3.
Sweeney, Latanya. 2002. “K-ANONYMITY: A MODEL FOR PROTECTING PRIVACY.” International Journal of Uncertainty, Fuzziness and Knowledge-Based Systems 10 (05): 557–70. https://doi.org/10.1142/S0218488502001648.