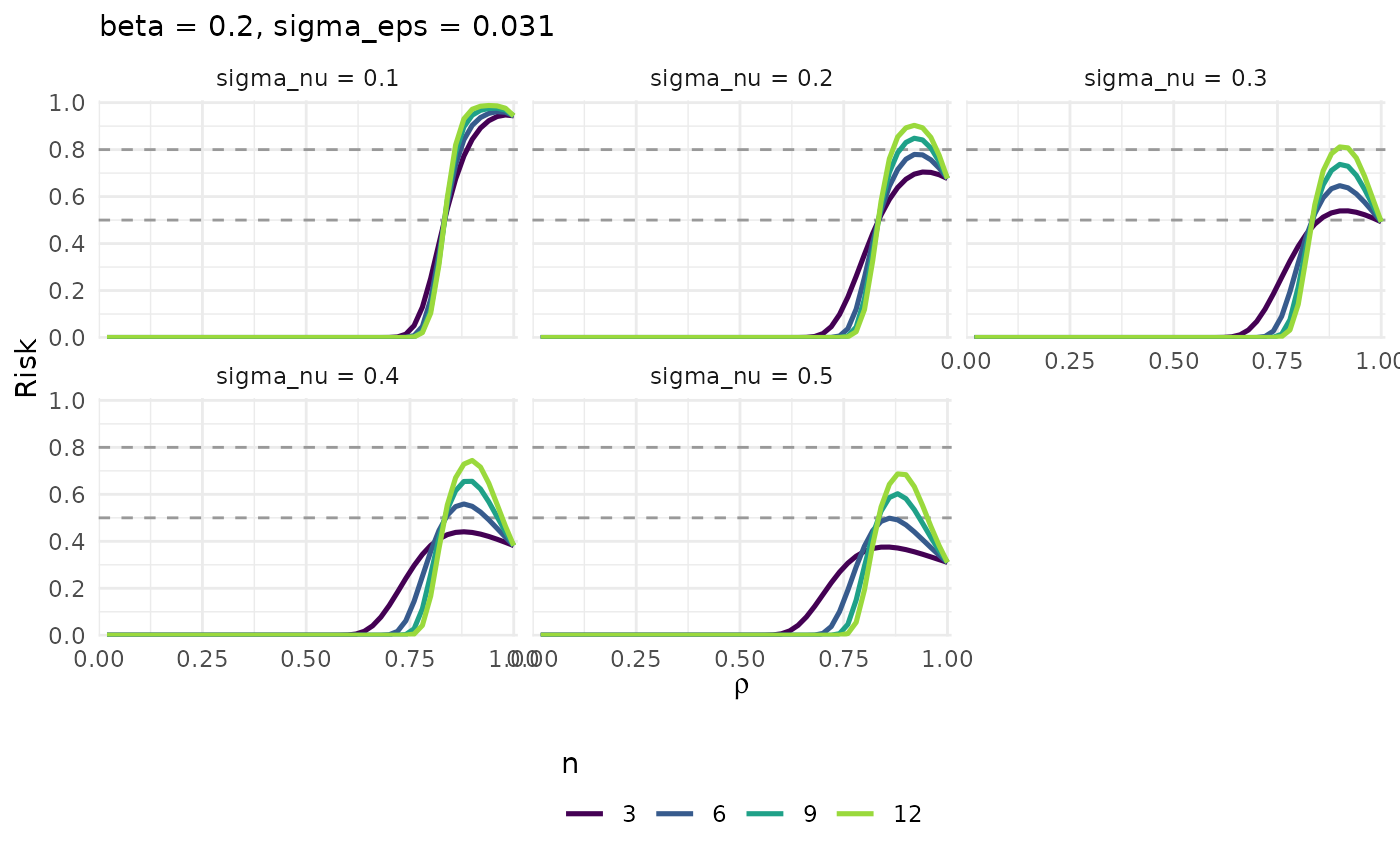
Plot method for a dominance calibration grid
Source:R/risk_utility_figures.R
plot.pm_calib_dominance.RdThin dispatcher over the three calibration plots.
Examples
grid <- pm_calib_dominance(sigma_eps = 0.031, beta = 0.2)
plot(grid)
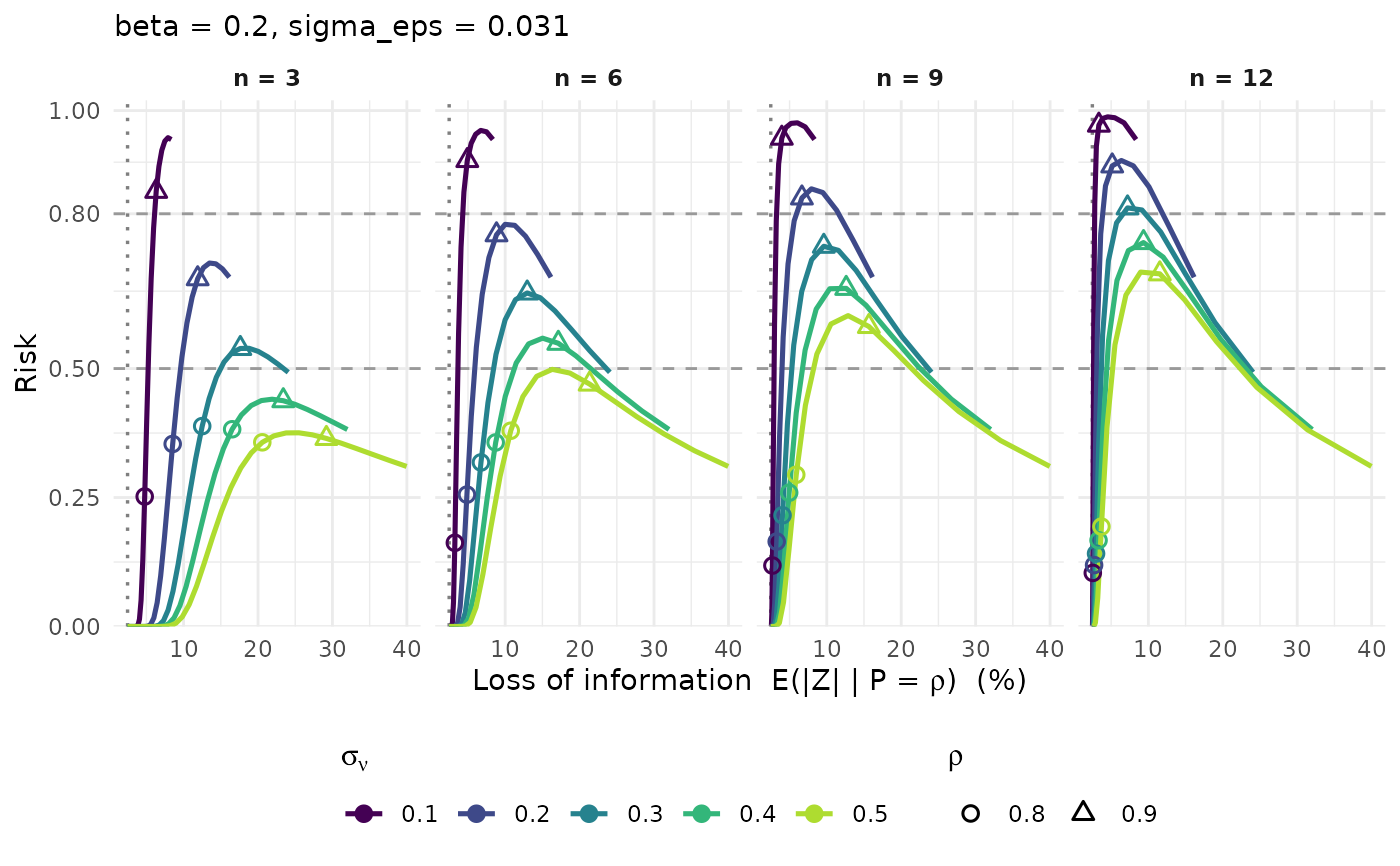 plot(grid, type = "profile")