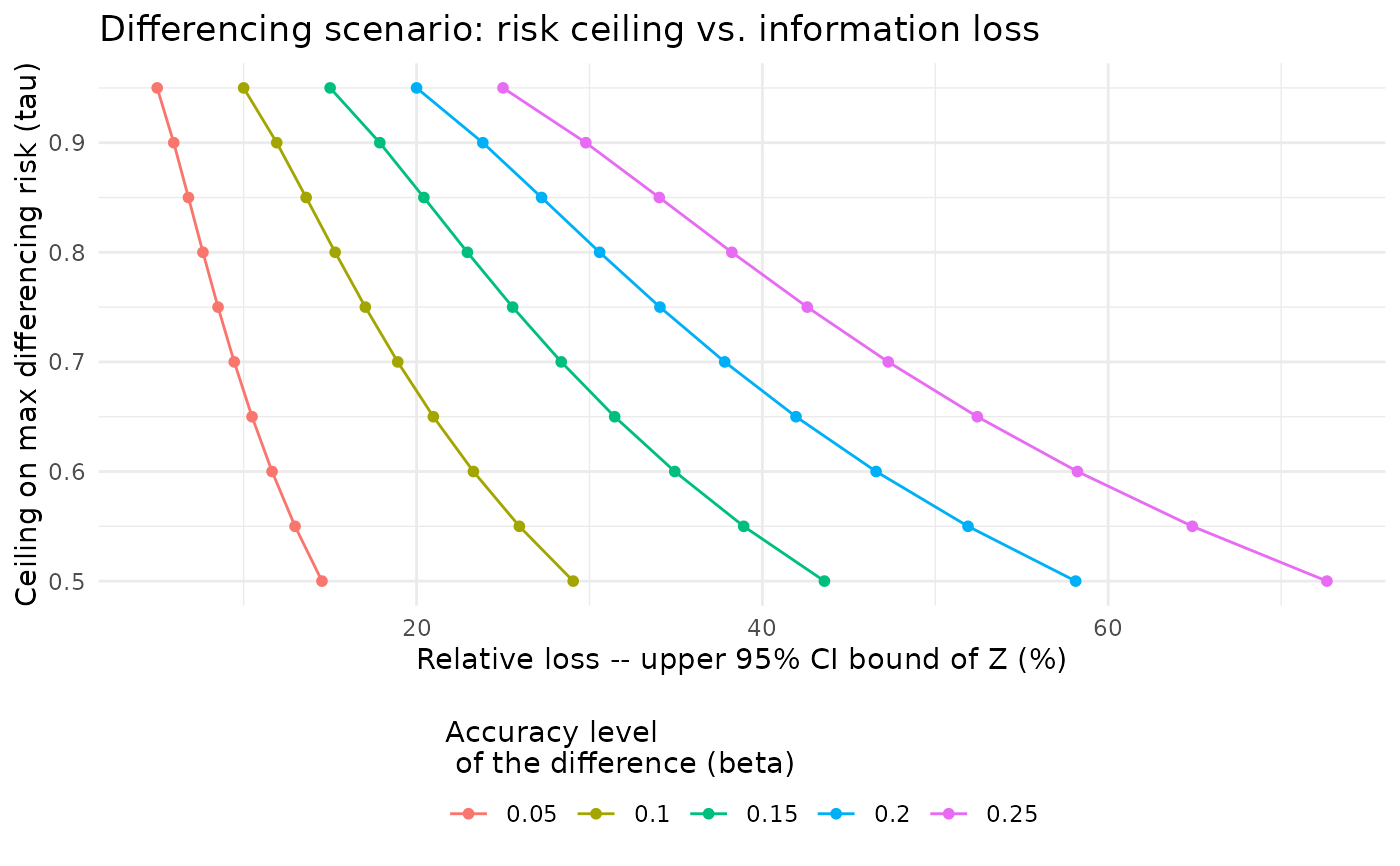
Plot method for a differencing calibration grid
Source:R/calibration_differencing.R
plot.pm_calib_diff.RdDraws the risk-utility frontier of the differencing step: the level risk ceiling tau
(guaranteed maximum differencing risk) against the relative loss (Z) level it costs
(either expectation of |Z| or upper bound of the confidence interval of it),
one curve per beta.
Arguments
- x
A
pm_calib_diffgrid, as returned bypm_calib_diff().- loss
One of
"CI"(for upper bound of the confidence interval),"EZ"(for expectation of the absolute relative loss |Z|): which loss metric to use on the x-axis.- ...
Ignored, for compatibility with the
plot()generic.